The Production Problem
Manufacturing a lithium-ion cell involves over a dozen sequential process steps — mixing, coating, drying, calendering, cutting, winding, filling, forming and testing. At every step, something can go wrong. In practice, reject rates in well-controlled production lines are not negligible:
production
assembly
& test
production
This means that without systematic quality control, roughly every 30th cell coming off the line would be defective — and potentially dangerous. Quality control is therefore not optional; it is a core safety measure.
How Defects Become Dangerous
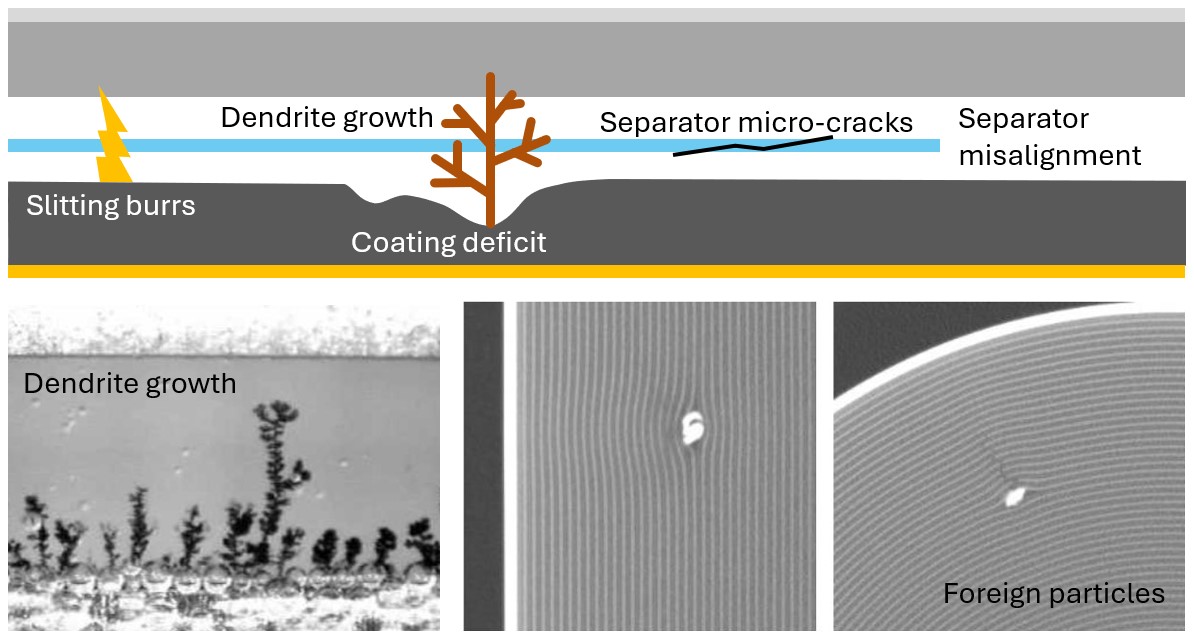
Manufacturing defects take many forms. A separator slightly misaligned during winding can create a direct path between electrodes. Insufficient electrode coating leaves bare anode spots where lithium cannot intercalate and instead plates as metallic lithium, growing dendrites that pierce the separator. Electrode cutting burrs, foreign particles, or tab-folding all interfere with ion flow and can similarly lead to dendrite formation.
These mechanisms are varied, but they share a single endpoint: an internal short circuit. And they are not rare edge cases — manufacturing defects account for approximately 90% of all internal short circuits that cause field failures at cell level.
When Quality Control is Not Enough
Even well-designed quality monitoring systems can have gaps. Imagine a supplier informing BMW that a foreign-particle sensor or a tab-folding detector was miscalibrated for the past six months — and that they cannot guarantee the cells delivered during that period are completely defect-free.
What is the right response? In the worst case, every affected vehicle must be individually inspected — an enormous logistical effort that costs time, money, and reputational damage. The question is whether there is a smarter alternative.
What if the vehicle itself could detect whether its battery pack contains a defect — and respond accordingly, before the situation becomes critical?
This is the concept of on-board diagnostics (OBD) for battery safety. A suspicious vehicle series could be placed remotely into an "elevated alert mode" — monitoring for anomalous behaviour. Vehicles showing suspicious patterns could be individually flagged for workshop inspection, while a protective operating window (reduced charge/discharge limits, active cooling, no fast-charging) keeps them safe in the meantime.
Voltage-Based Short Circuit Detection
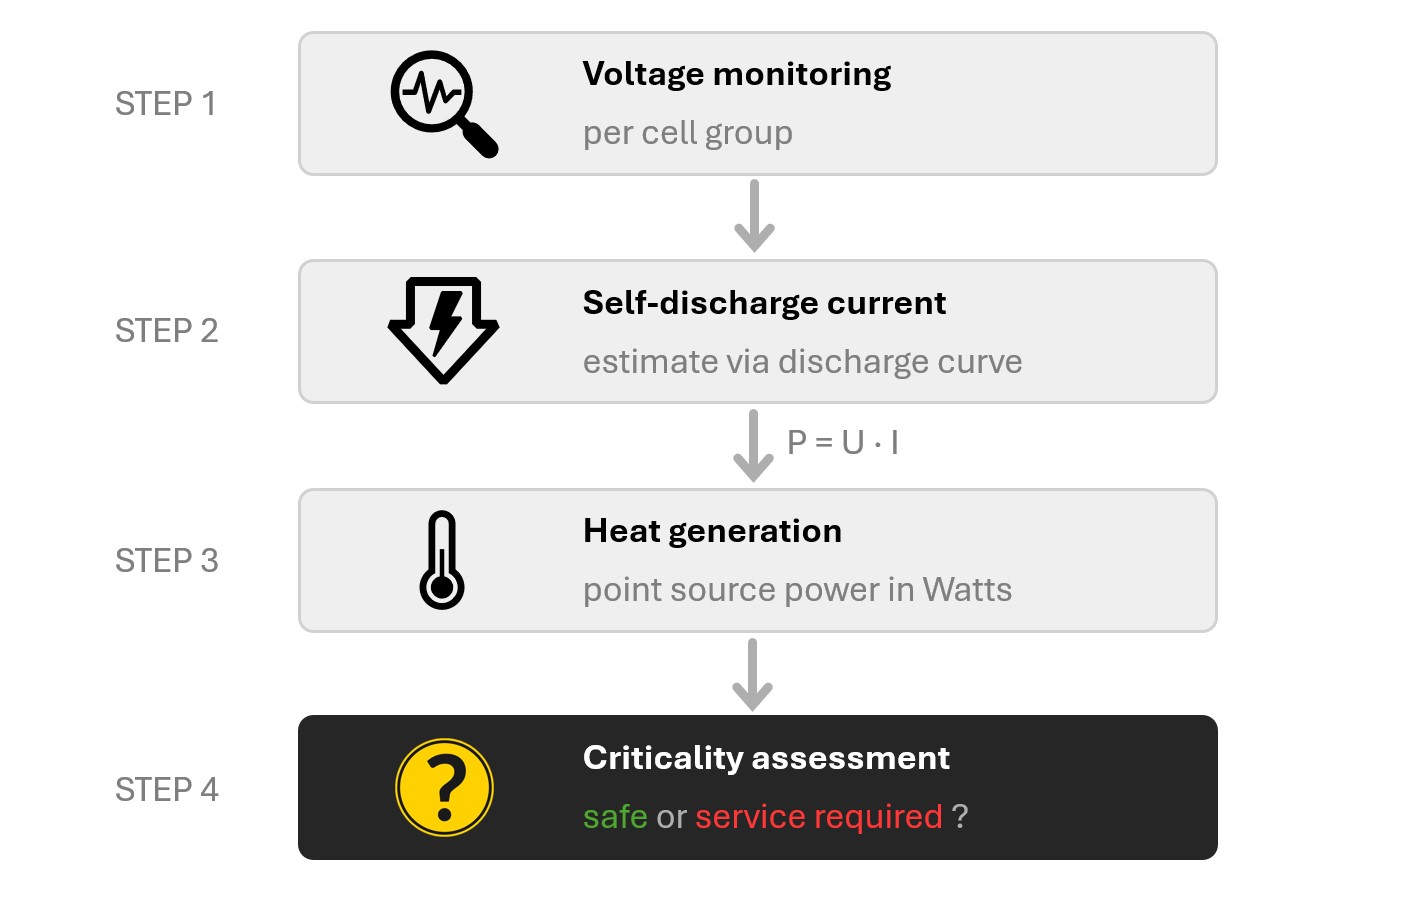
BMW's BMS already measures voltage per parallel group — a sensor that is present in every production vehicle. An internal short circuit acts as an additional current consumer, converting stored electrical energy into heat. This leaves a characteristic signature:
- During charging: the affected cell charges more slowly than its neighbours in the same parallel group
- At rest: the affected cell self-discharges faster than its neighbours
By comparing voltage curves within a parallel group, the BMS can estimate the leakage current — and from that, the thermal power being generated: Q̇ = U · I.
Detection, however, is only half the problem. The harder question is: at what level of detected heat generation should we intervene? Is 10 mA of self-discharge worth a workshop visit? What about 100 mA? 1 A? Without a reference, there is no principled answer.
What ohmic heat power can a Li-Ion cylindrical cell tolerate from an internal short circuit before thermal instability sets in?
This was the central question of my master's thesis.
Simulation Approach
To answer this question, I developed a 3D thermal simulation in Star-CCM+. A defective cell is not a passive object — it stores both electrical and chemical energy, and the outcome of a short circuit depends on the interplay of four factors:
The input variable — how much heat the short circuit generates locally. This is the disturbance that may or may not destabilise the cell.
The cell geometry and material conductivities determine how heat spreads from the hotspot — and how quickly it can escape to the surroundings.
The jelly roll stores chemical energy. At elevated temperatures, exothermic reactions begin self-heating the cell — an amplifying feedback loop.
The rate at which the surrounding pack structure carries heat away from the cell sets the ceiling for how much hotspot power the system can tolerate.
Initial Hotspot Heat Power
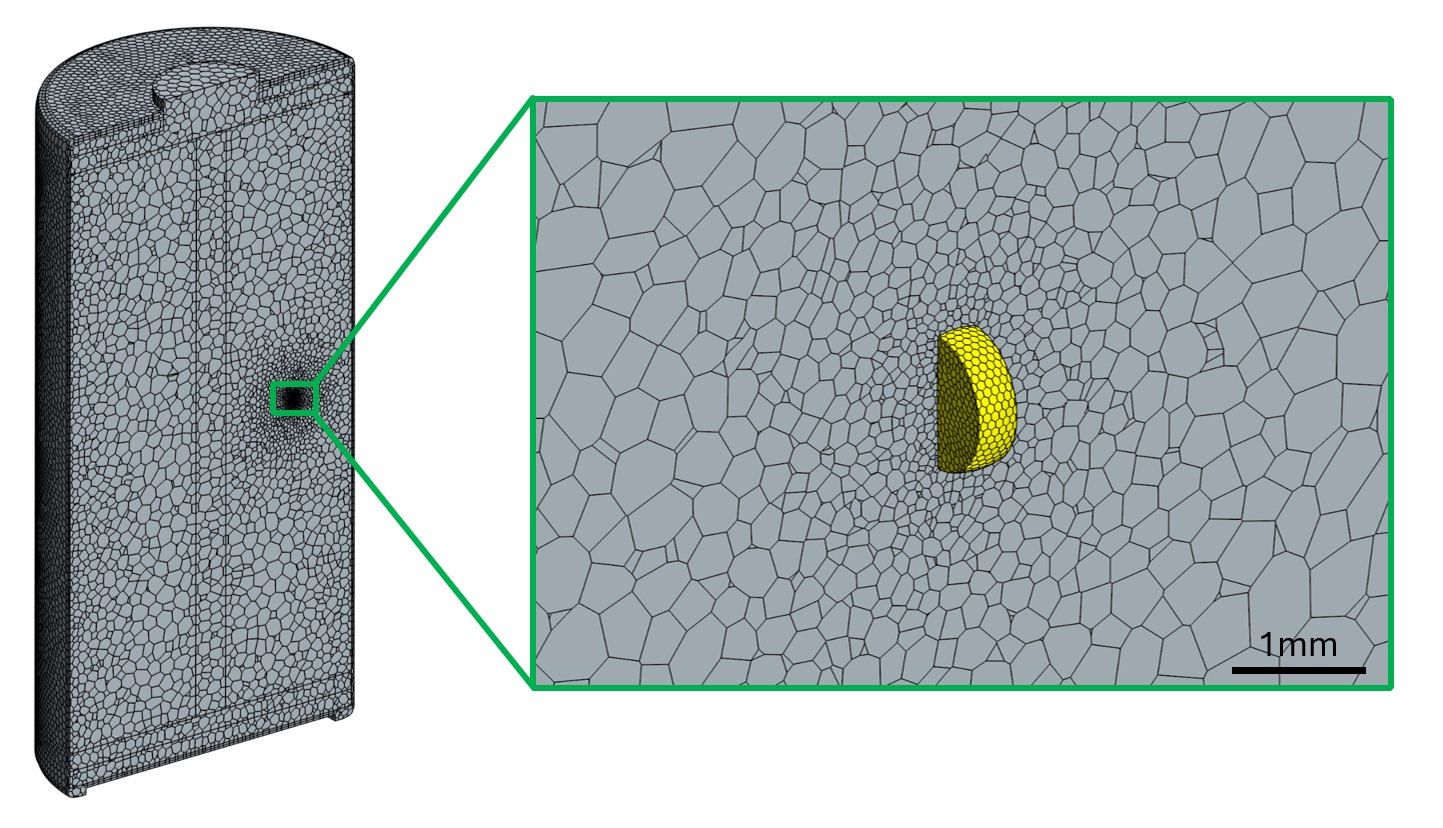
The short circuit is modelled as a small volume element inside the 3D jelly roll — a configurable heat source whose power, position, and size I can set freely. Think of it as a "spark plug": I can place it anywhere in the cell and ask whether its heat output ignites the cell or not.
The mesh is refined locally around this hotspot to resolve the steep thermal gradients that develop there.
Thermal Resistances: Anisotropic Jelly Roll
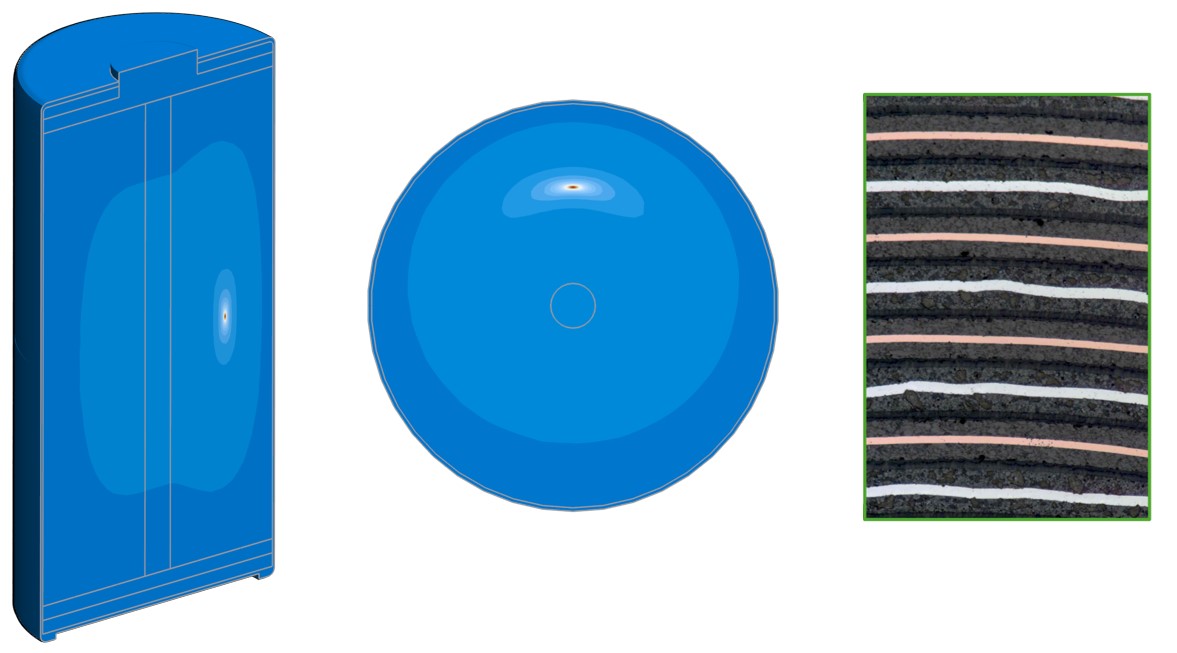
The cell periphery — aluminium top current collector, copper bottom current collector, plastic spacer, electrolyte-filled gaps — is modelled with material properties taken from literature.
The jelly roll is the key challenge. It is not a homogeneous material but a wound stack of separator, anode, cathode, and collector foils — each with its own thermal conductivity. Resolving every individual layer would require an impractically fine mesh.
Instead, I mesh the jelly roll as a homogeneous body but assign direction-dependent (anisotropic) conductivity in a cylindrical coordinate system:
- Axial & polar directions (along the electrodes): high conductivity — heat travels easily along the wound layers
- Radial direction (through the layer stack, crossing separators): much lower conductivity — the separator sandwich acts as a thermal barrier
This produces a characteristic temperature profile around a hotspot: an ellipse in cross-section, curved to follow the winding of the electrodes; a straight ellipse in the axial view, where the electrodes run straight.
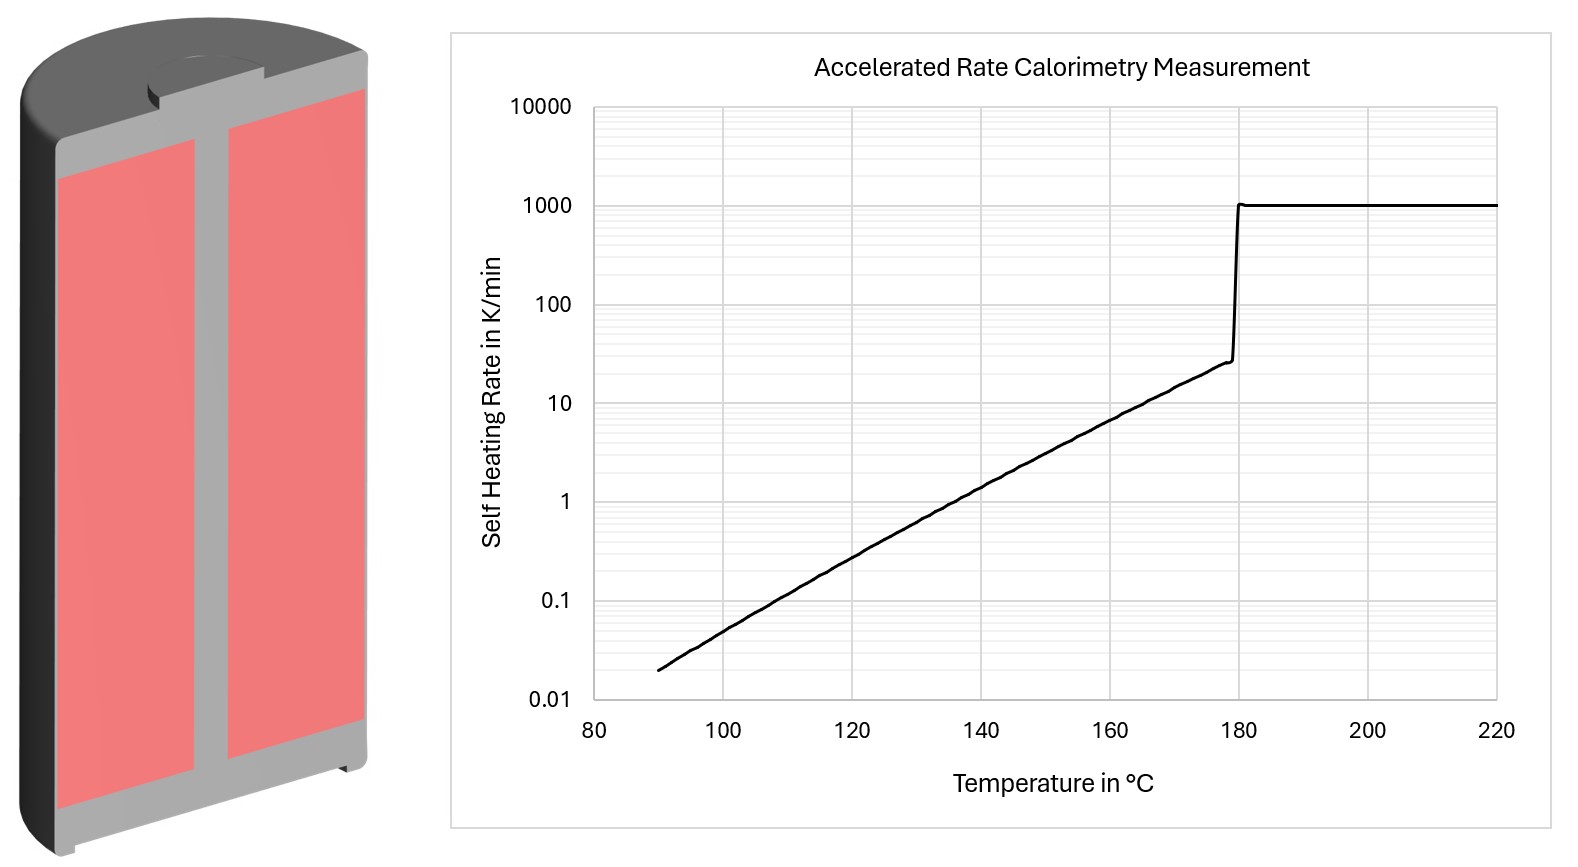
Thermal Reactivity: Chemical Self-Heating
A charged jelly roll is not just a passive thermal mass — it stores chemical energy that is released exothermically at elevated temperatures. As the hotspot heats up the surrounding material, exothermic reactions begin contributing their own heat — a runaway feedback loop.
I implemented this using ARC (Accelerated Rate Calorimetry) data from experimental measurements: a temperature-dependent self-heating rate curve that drives volumetric heat generation throughout the jelly roll. For example, any point in the jelly roll that reaches 140 °C will begin self-heating at approximately 1.5 K/min — independently of the original hotspot.
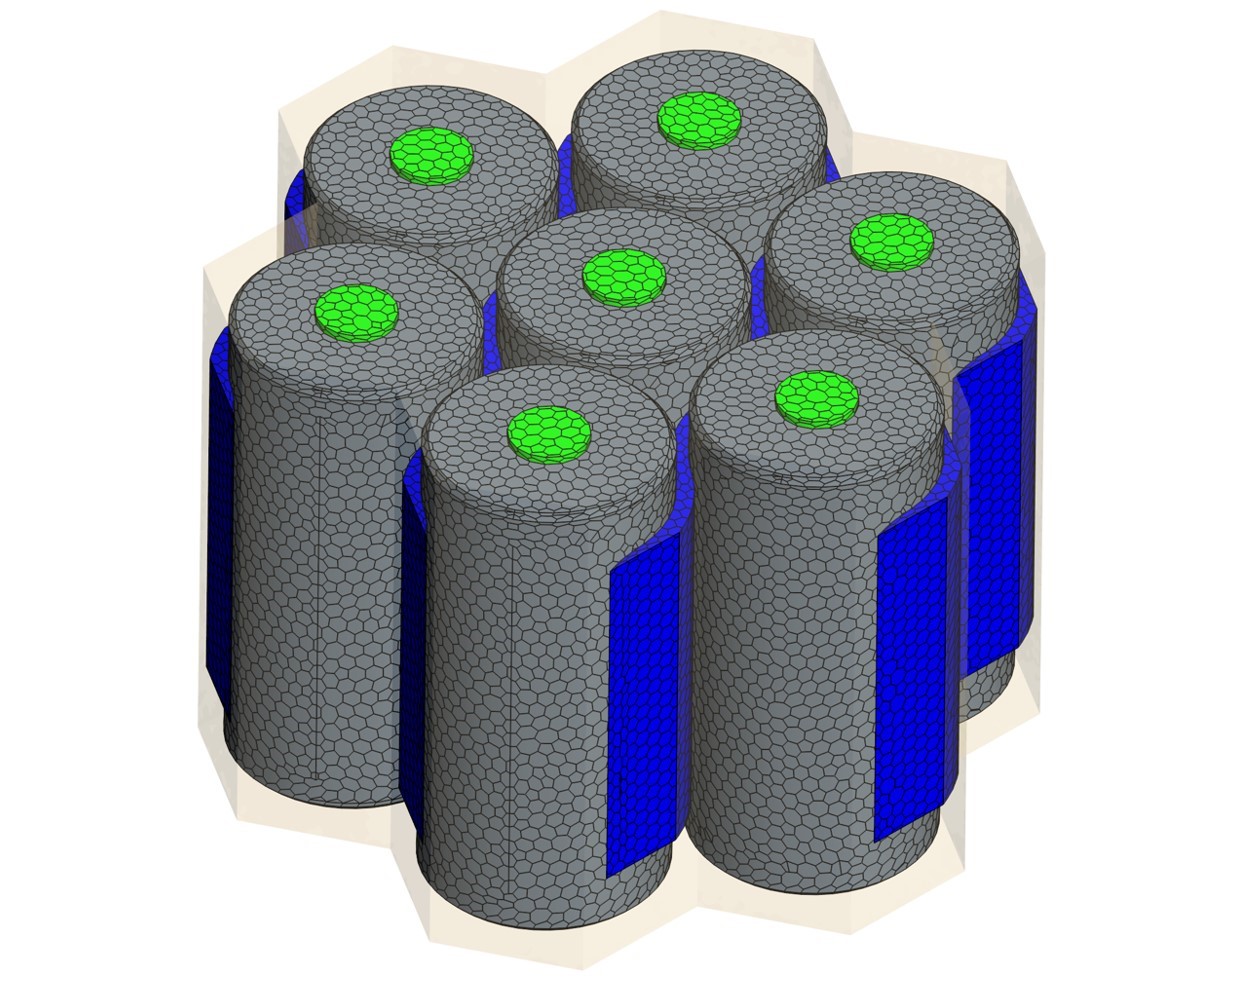
Heat Dissipation: Realistic Pack Environment
A cell in a vehicle pack is not suspended in free air. It is surrounded by neighbouring cells, passive cooling elements, and foam filling — all of which affect how quickly heat can escape.
To capture this, I expanded the simulation system from a single cell to a representative pack section: six neighbouring cells arranged around the defective one, with passive aluminium cooling channels between them and foam filling the remaining gaps. The convection boundary condition is applied not at the cell surface, but at the outer boundary of this entire system — with a heat transfer coefficient of 5 W/m²·K, typical for passive air cooling.
Finding the Critical Threshold: Iterative Search
To find the critical heat power, I use a binary-search approach. Starting with a low power level and stepping upward by 1 W, I run the simulation until it either converges to a stable thermal equilibrium or diverges into runaway. This narrows the threshold to a 1 W window, after which I repeat with a finer step of 0.1 W.
For example, at an ambient temperature of 30 °C, with the hotspot in the jelly roll centre:
The threshold lies somewhere between 5 and 6 W. A second pass with 0.1 W steps refines it to 5.7 W (stable) / 5.8 W (runaway) at these conditions:
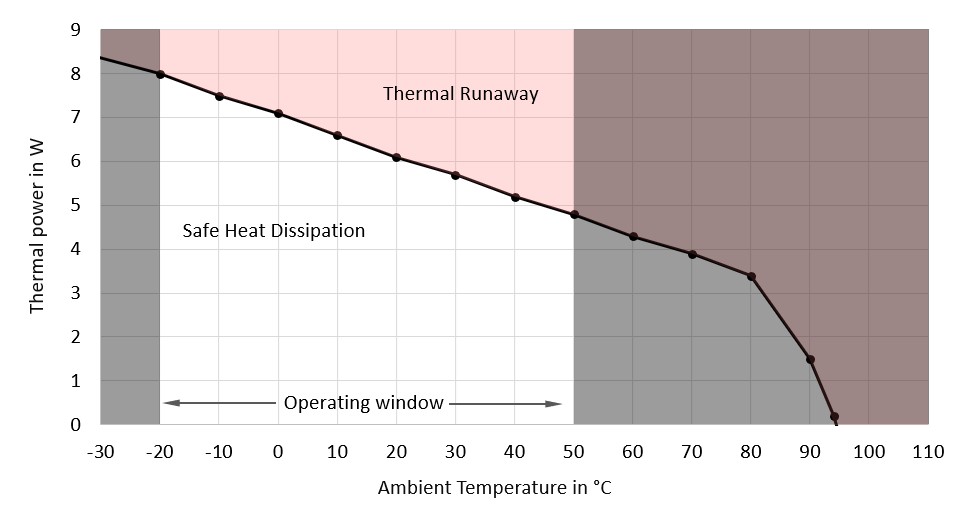
Results: Ambient Temperature Dependency
The first parameter study varied ambient temperature across vehicles operating window. The result is a curve of critical heat power as a function of temperature — everything above the line triggers runaway, everything below is safe.
The direction of the trend is intuitive (hotter surroundings reduce the cell's tolerance), but the quantitative values are new:
(cold winter operation)
(summer, charging in the sun)
Across the full operating window of −20 °C to +50 °C, the critical threshold changes by approximately 40%. For an on-board diagnostic algorithm, this means a single fixed detection threshold would be too conservative at cold temperatures and potentially unsafe at high ones — the algorithm must be temperature-aware.
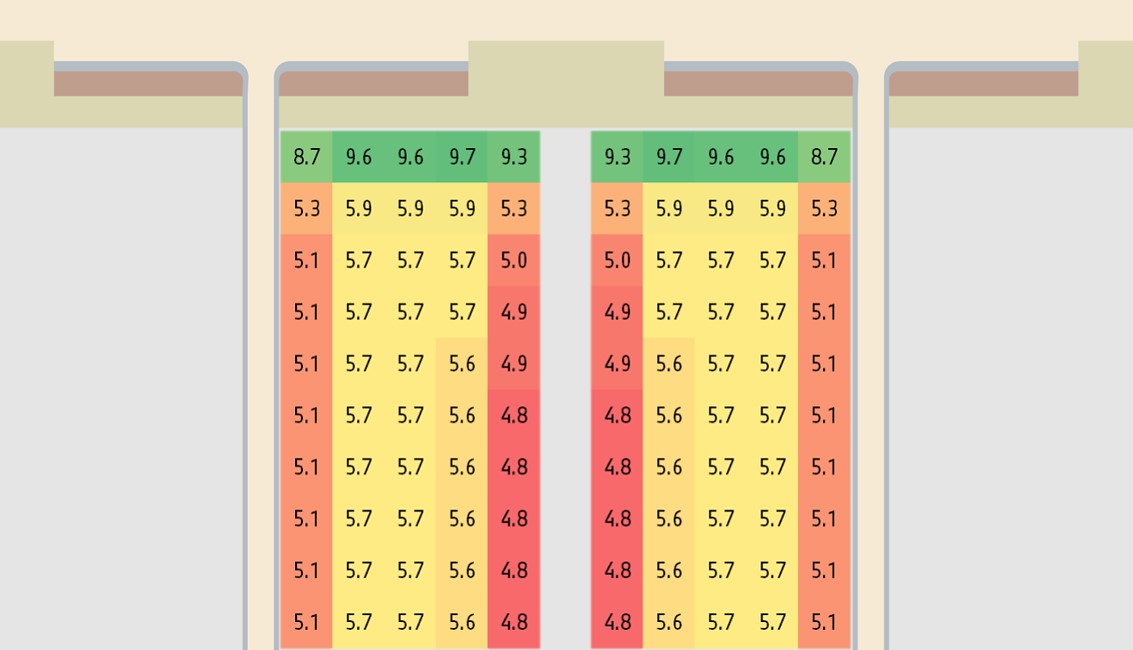
Results: Spatial Position Dependency
The second parameter study mapped the critical threshold across every position inside the cell. Within the jelly roll bulk, the threshold is relatively uniform — the anisotropic conductivity is constant there. Differences appear at boundaries between components:
- Core (worst case): ~4.8 W — the electrolyte-filled core has 3–4x lower radial conductivity than the jelly roll, trapping heat more effectively
- Outer edge: ~5.1 W — the thermal contact resistance between jelly roll and can acts as additional insulation on one side, slightly reducing tolerance
- Jelly roll bulk: ~5.6–5.7 W — consistent throughout the main winding volume
Passive cooling channels between neighbouring cells make surprisingly little difference — without active flow, the aluminium channels provide only a modest improvement (5.3 W vs. 5.1 W adjacent to foam).

The axial (height) study tells a different story. Near the top and bottom of the cell, where the jelly roll contacts the aluminium and copper current collectors directly, heat can escape much more effectively — the threshold rises to ~9.3–9.7 W. This is because there is no additional thermal resistance between the jelly roll and the metallic current collectors at those positions.
What the Numbers Mean
Combining the temperature and position studies gives a complete picture of the cell's tolerance landscape. The worst-case position (core) at high ambient temperature (50 °C) represents the most vulnerable scenario in real operation. The best-case position (near current collectors) at cold ambient temperature produces a threshold nearly twice as high.
The ~50% difference between worst and best case positions means that a short circuit's location matters enormously — and that a conservative, position-agnostic threshold would be appropriate if position cannot be inferred from monitoring data.
These results provide the first physically-founded quantitative basis for parametrising BMW's on-board diagnostic algorithm: the BMS can now compare its estimated heat generation against a threshold that accounts for both ambient temperature and — in future refinements — probable short-circuit location.
Contribution & Next Steps
This thesis bridges a gap that previously had no solution. Short circuit detection via voltage monitoring was already possible — but there was no principled basis for deciding when a detected event requires intervention. The simulation provides:
- The first physically-founded, quantitative critical thresholds for internal short circuits in BMW's cylindrical cells — numbers that were simply not available before
- A simulation tool that can be extended to other scenarios, such as fast-charging (where electrode ohmic heating adds to the background temperature) or different cell chemistries
- A clear path toward a complete on-board diagnostic system: not just detecting that something is wrong, but knowing how serious it is
The presentation was circulated across two BMW departments and repeated for a second audience on request.
Tools & Skills
See next